/* Database+Disk+Performance™ */ Database+Disk+Performance™ /* */ /* -- -- */ /* Footer ----------------------------------------------- */ #footer { width:660px; clear:both; margin:0 auto; } #footer hr { display:none; } #footer p { margin:0; padding-top:15px; font:78%/1.6em "Trebuchet MS",Trebuchet,Verdana,Sans-serif; text-transform:uppercase; letter-spacing:.1em; }

Tuesday, March 10, 2009

New Workshops: SQL Server Performance - Free

[Reposting as the formatting was very poor on the original post.]

Upcoming Events: Workshops

Workshop Dates


Detroit March 30 & 31

New York City April 2 & 3

Tokyo April 9 & 10

Houston April 23 & 24

Chicago May 12 & 13

Philadelphia May 14 & 15


Workshop Abstract


There are many classes that cover SQL Server. There are also just as many that cover Oracle Applications… but very few cover the intersection of the two.

This two day workshop covers the specifics of how the Oracle application interacts with SQL Server and how to architect a scalable and highly available solution. Its focus starts at the ODBC level and goes down to the disk.

Emphasis is on isolating issues, finding problems before they happen, and performance tuning. The goal of the workshop is to move beyond “my system’s slow” into WHY it’s slow and how to fix it. We’ll cover: what to look at, what it means, and what “good” & “bad” look like on a wide variety of platforms.

While the workshop is in lecture format, real world examples are used exclusively in the form of perfmon and profiler traces in addition to numerous trip reports and health checks that have been done with customers over the last 5 years. We’ll use out of the box tools and basic scripts to gather up information and apply common sense techniques to come up with answers.

Skills learned in this workshop can also be applied to other enterprise applications in your landscape.

Target Audience: DBAs, Siebel/PeopleSoft/JD Edwards Administrators, Consultants

Working knowledge of SQL Server is encouraged.


Registration


Please pull down the registration form here:

http://www.computationpress.com/microsoftoraclecoe/moceevents.html

And e-mail to frankmcb@microsoft.com

Note, NYC is almost completely full. Philly has space. Detroit has space. Houston is filling fast. Chicago has space.

Tuesday, December 30, 2008

SQL Server Performance Workshop

SQL Server Performance Workshop: ERP & CRM

This two day Microsoft taught workshop covers the specifics of how the Oracle application (Siebel, PeopleSoft, JD Edwards) interacts with SQL Server and how to architect a scalable and highly available solution. Its focus starts at the ODBC level and goes down to the disk.


Cities Taught In

Zurich, Switzerland

Tallinn, Estonia

Stockholm, Sweden

New York, NY

Los Angeles, CA

San Francisco, CA

Please view the complete logistics at: www.computationpress.com


Abstract

There are many classes that cover SQL Server. There are also just as many that cover Oracle Applications… but very few cover the intersection of the two.

This two day workshop covers the specifics of how the Oracle application interacts with SQL Server and how to architect a scalable and highly available solution. Its focus starts at the ODBC level and goes down to the disk.

Emphasis is on isolating issues, finding problems before they happen, and performance tuning. The goal of the workshop is to move beyond "my system's slow" into WHY it's slow and how to fix it. We'll cover: what to look at, what it means, and what "good" & "bad" look like on a wide variety of platforms.

While the workshop is in lecture format, real world examples are used exclusively in the form of perfmon and profiler traces in addition to numerous trip reports and health checks that have been done with customers over the last 5 years. We'll use out of the box tools and basic scripts to gather up information and apply common sense techniques to come up with answers.

Skills learned in this workshop can also be applied to other enterprise applications in your landscape.

Target Audience: DBAs, Siebel/PeopleSoft/JD Edwards Administrators, Consultants

Working knowledge of SQL Server is encouraged.


Event Registration

Please e-mail Susan Meyer at v-sumeye@microsoft.com to register for the event.


Topics Covered

Top Reasons for SQL Server 2005/2008

Query Repro: Reproducing Problem Queries Outside of the Application and Tools to Fix Them

Performance Tuning Methodology: A Repeatable Process

Hands on Performance Tuning Lab

Databases & Disk Drives: Architecting a Scalable Solution

SQL Server Settings

Case Study Handouts

Architecting for RSCI

SQL Server Compression

Hyper-V and Virtualization

Monday, May 12, 2008

SQL Server Performance Methodology with Oracle Applications

This deck presents a systematic way of defining and solving performance issues with Oracle Applications. It gives an overview of how disk architecture impacts performance, how to run a trace, and reproduce the queries properly outside of the application.

Please go to www.computationpress.com website to download this deck.

Performance Methodology Flow Chart

I have uploaded my Performance Methodology Poster (PDF format) to the Computation Press website:

www.computationpress.com

The poster outlines steps and scripts needed to go in and resolve performance issues with enterprise applications (ERP & CRM).

Database & Disk Deck

I have posted the deck I give at conferences on database and disk drives. It's a "shorter" deck (ie. One hour talk), instead of the larger deck I sometimes use that covers 4 hours.

A short abstract:

It focuses on how to create a scalable database solution on everything from direct attached SCSI to SANs. The deck covers perfmon counters, partition alignment, SQL IO performance testing, proper number of files for space management, etc...


www.computationpress.com

Friday, February 08, 2008

Finding Queries That Kill Your System

The following is a short article on how to locate poor queries on a JD Edwards/PeopleSoft/Siebel system. I will be following it up with a more comprehensive version taking into account debugging batch jobs and more in depth techniques such as using Excel to drill into issues. But for the moment, I wanted to get this something short and simple posted ASAP.

Introduction

The most difficult issue in finding performance issues usually revolves around just defining what the problem is in the first place. This article will focus on how to use Profiler to capture the necessary data and comb through it to define where the issues are and then using the Database Tuning Advisor (DTA) to solve them.

There are two ways to find long running/resource intensive queries on a system. The first is to use dynamic management views (DMVs) provided in SQL Server 2005, the second is to use Profiler.

In SQL Server 2005, there are a variety of new DMVs that provide insight into how/why your system is running slow. The main drawback to them are the fact that they provide a "macro" view of the system and can lack the ability to pinpoint exactly where issues are at. For example, a DMV cannot be initialized at the beginning of a job to "reset" the counters for a baseline or that the data collected in the DMV may reflect changes since yesterday or a week ago depending on the available memory to store the information.

While DMVs are great tools, they are still not a substitute for SQL Server Profiler. Profiler allows you to capture data over a user defined period of time to nail down a specific job or user. This flexibility lets the DBA get a more granular picture of the situation or, if the trace is run for a day, a macro view of your entire system.

This paper offers a simple step by step method for prioritizing and attacking problems.

Please look for this paper to be posted by February 9, 2008 at www.computationpress.com


Monday, January 14, 2008

Calculating How Often An Index Is Used In SQL Server 2005

Over the last week, I have been working with several customers trying to manage performance by cutting down the number of non-used indexes in the database. In many canned apps, it's not unheard of to see 50 to 80 indexes on a table where only 10 or 15 are actually populated and used. The problems that occur because of this are numerous: extra disk used, longer backups, and of course—INSERTS, UPDATES and DELETES take much longer.

One of the main pains in using the DMVs are not being able to initialize them and then sorting through the extra data generated in the process. I wrote a few scripts and decided to turn them into a small TechNote on this subject. The core of the paper provides a method for solving this common problem by using the DMV sys.dm_db_index_usage_stats.

Examples and ideas covered work for SAP, PeopleSoft, Siebel, JD Edwards, and many other canned applications that provide out-of-the-box schema.

The full paper is posted at: www.computationpress.com

Best Regards,

Frank

Wednesday, January 02, 2008

Call for Content

Finished the last paper and thinking about a new topic. I have probably a dozen or so possibilities, but I'd like to open the floor to the readers and ask the question: What is important to you? What topic would you like written about next that centers around databases + disk + performance?

Please send me an e-mail @ frankmcb@gmail.com and let me know.

Look forward to hearing from you.


Best-

Frank

Saturday, December 29, 2007

Paper Published & Posted: Poor Disk Performance, Time Outs, Database and the SQL Server Errorlog

Sorry for the delay of a few days. Was caught up in an escalation and the paper went longer than I thought it would—21 pages with references and end notes. Please review this draft and feel free to comment on it. The graphics need to be cleaned up some, etc…

Please find the paper posted on: www.computationpress.com

Best Regards,

Frank

Tuesday, December 25, 2007

Poor Disk Performance, Time Outs, Database and the Errorlog: SQL Server has encountered % occurrence(s) of IO requests taking longer than 15 seconds to complete on file

The SQL Server errorlog provides a wealth of information and is often overlooked, even though it should be the first place we all turn to. The problem though is that most people look at the errorlog only after a problem has occurred instead of proactively looking at it as part of the daily list of tasks.

I've written a TechNote on a common error that affects the disk subsystem and the database and shows up in the errorlog as:

SQL Server has encountered 4507 occurrence(s) of IO requests taking longer than 15 seconds to complete on file [D:\Program Files\Microsoft SQL Server\MSSQL\Data\BIGDB_Data.MDF] in database [BIGDB] (7)

While many people have blogged on WHAT this issue is and WHAT to look at. Microsoft has published KB Article 897284 on the topic—which gives a good DESCRIPTION. I want to explore more of the areas around WHY it happens and suggest some actual suggestions on HOW to fix it.

Please visit the Computation Press website on December 26, 2007 and I'll have the note posted.

www.computationpress.com

Wednesday, December 19, 2007

After a long absence, I'm going to kick start this blog again. Over the last year, I've been refining more performance techniques and thoughts as I've been working. More scripts and tools. In addition to the blog, I'll also start creating and posting videos to accompany the postings.

Look for a new posting in the next week.

Best-
Frank

Thursday, July 06, 2006

Index Covering: Database, Disk IO, and Enterprise Apps

The Series


This is the first in a series of articles on Index Covering which is a performance technique to cut down disk IO and improve query performance. The first article here will define the basic elements in a query execution plan and how to find the bad parts. The next article will show how to fix them. Finally I'll conclude with some larger examples from PeopleSoft, JD Edwards, Siebel and SAP.


Introduction


Databases have two basic structures for storing information. Index pages and data pages. Both reside on the disk. To achieve optimal performance, DBA’s create indexes which are really just organized subsets of data.


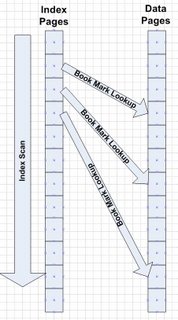
Since an index is a subset of data, extra reads are often needed to find all the additional information. Typically, this requires a bookmark lookup.


These extra reads on a disk can add up quickly and cause poor performance. The extra IOs also cause the database to use cache less efficiently.


What is a bookmark lookup?


Databases have a concept called “book mark lookups”. This means that the database has to find what it needs in the index page, then find the corresponding data page for the rest of the information required.


Think of it like this: A person needs to find George Washington’s birthday. They look in the index of an encyclopedia to find “Washington, George” which tells them to turn to page 98 to find an entry on him. On page 98, they find the birthday. This is an example of a “book mark lookup”. The researcher looks in the index, keeps their finger there, turns to a page in the book, finds the birthday for the rest of the information.


A bookmark lookup occurs when the database cannot find all the needed information for a query in the index page and so it goes to the data page to complete the request.


For example:

create table A (col_one int, col_two int, col_three int)

Go

create index A_P1 on a(col_one, col_two)

Go

[Data added to table…]

Select col_three

From A

Where col_one = ‘22’


In this example, the query would used index A_P1 to find the row pointer to the data page in the table, but since A_P1 index does not contain column col_three, it would have to do a book mark lookup from the index to the data page.


Why are bookmark lookups bad for performance?


Not all bookmark lookups are horrible. It just means that the database had to do some extra IO to find the data it needed. If you are only hitting a few rows, then it’s not an issue. If you are having to sort through hundreds or thousands of rows to find the one row you needed, or are in a massive nested loop, then book mark lookups can be a problem.


There are several examples below which will illustrate the pain in enterprise apps that can be large and small depending on the query.


How do you know you have a bookmark lookup?


A bookmark lookup shows up in the execution plan (ex. set statistics profile on) looking like this:


|--Bookmark Lookup(BOOKMARK:([Bmk1001]),OBJECT:([JDE_CRP].[CRPDTA].[F4311] AS [T1]))


Ok, so I got bookmark lookups, so what?


First, figure out if it’s causing a drag on the system. Look at the number of rows and executions that the bookmark lookup is using. Is it 5 or 50,000? This can be seen on the left hand side of the execution plan using set statistics profile on command.


In this example, zero rows were brought back and the loop was executed only once. This bookmark lookup was not a problem.


Rows Executes StmtText

------ --------- ---------------------------------------------------

0 1 |--Nested Loops(Inner Join,

0 1 |--Sort(ORDER BY:([T0].[ILUKID] DESC))

0 1 | |--Bookmark Lookup(BOOKMARK:([Bmk1000]),

0 1 | |--Index Seek(OBJECT:([JDE_CRP].[CRPDTA].[F4111].[x] AS

0 0 |--Clustered Index Seek(OBJECT:([JDE_CRP].[CRPDTA].[F4311].


Here is an example where a bookmark lookup caused severe problems. It is bringing back 85 million rows and is being executed 4,017 times.


Rows Executes StmtText

----------- ----------- ------------------------------------------------------------

1 1 |--Nested Loops(Inner Join, WHERE:([T1].[PR_POSTN_ID]=

364442 1 | |--Index Scan(OBJECT:([Siebel_Prd].[dbo].

85205956 4017 | |--Bookmark Lookup(BOOKMARK:([Bmk1001])

85205956 4017 | |--Nested Loops(Inner Join, OUTER

4017 4017 | |--Nested Loops(Inner Join, OUTER

4017 4017 | | |--Bookmark Lookup(BOOKMARK:([Bmk1002

4017 4017 | | | |--Nested Loops(Inner Join,

4017 4017 | | | | |--Bookmark Lookup(BOOKMARK:([Bmk

4017 4017 | | | | | |--Index Seek(OBJECT:([Siebel_

4017 4017 | | | | |--Index Seek(OBJECT:(

4017 4017 | | |--Clustered Index Seek(OBJECT:([Siebel

85205956 4017 | |--Index Seek(OBJECT:([Siebel_Prd].[dbo].[S_